Learn · Stage 2: Learn the platform · guide 2 of 6
A tour of the MetaTrader screen: Market Watch, charts, timeframes and indicators
MetaTrader looks busy at first, but it has only four main areas.
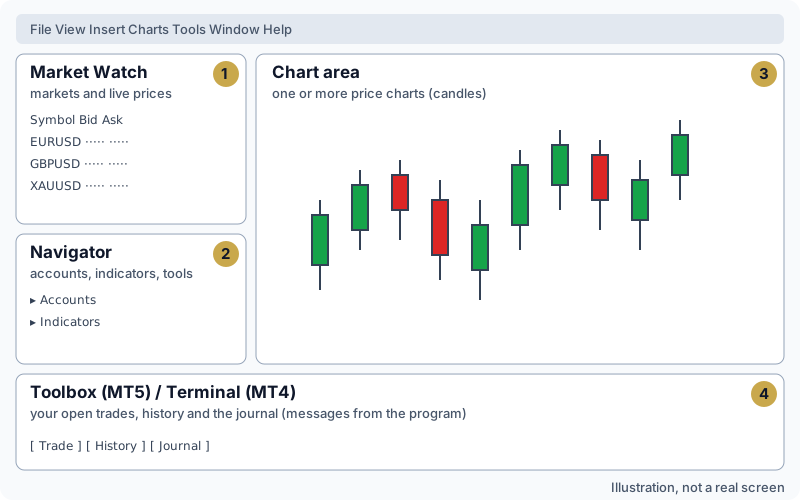
- 1 Market Watch — the list of markets with their live buy and sell prices.
- 2 Navigator — your accounts, indicators and tools.
- 3 Chart area — one or more price charts.
- 4 Toolbox (MT5) / Terminal (MT4) — along the bottom: your open trades, your history and the Journal (messages from the program).
Closed a window by accident? Open the View menu and switch it back on. Nothing is lost.
Markets and symbols: each market has a short code, such as EURUSD (euro against US dollar) or XAUUSD (gold priced in US dollars). Some brokers add a suffix, such as EURUSD.a — it is the same market. To show more markets, right-click in Market Watch → Symbols → choose the market → Show. Right-click → Specification shows its trading hours and smallest trade size.
Charts: drag a market from Market Watch onto the chart area. Zoom with + and − (or the mouse wheel), and drag the chart to the right to see older prices. Auto-scroll keeps the newest price in view.
Timeframes: each candle can show one minute, one hour, one day and so on. Use the timeframe buttons on the toolbar (M1, M5, M15, M30, H1, H4, D1, W1, MN). The same market tells a different story on different timeframes — see How to read a candlestick chart.
Indicators: Insert → Indicators, or drag one from the Navigator onto the chart. Add one at a time and learn what it shows before adding more.
MT4 and MT5 differences you will notice:
- the bottom window is called Terminal in MT4 and Toolbox in MT5;
- MT4 has 9 timeframes, MT5 has 21;
- closed trades are under Account History in MT4 and History in MT5.
Official help: Market Watch in MT5 (opens in a new tab).
Continue in the course: the Foundation Course — start free, 14 days, no card
Trading involves significant risk of loss. Practise on a demo account first. Holy Trading Science provides education, not financial advice.